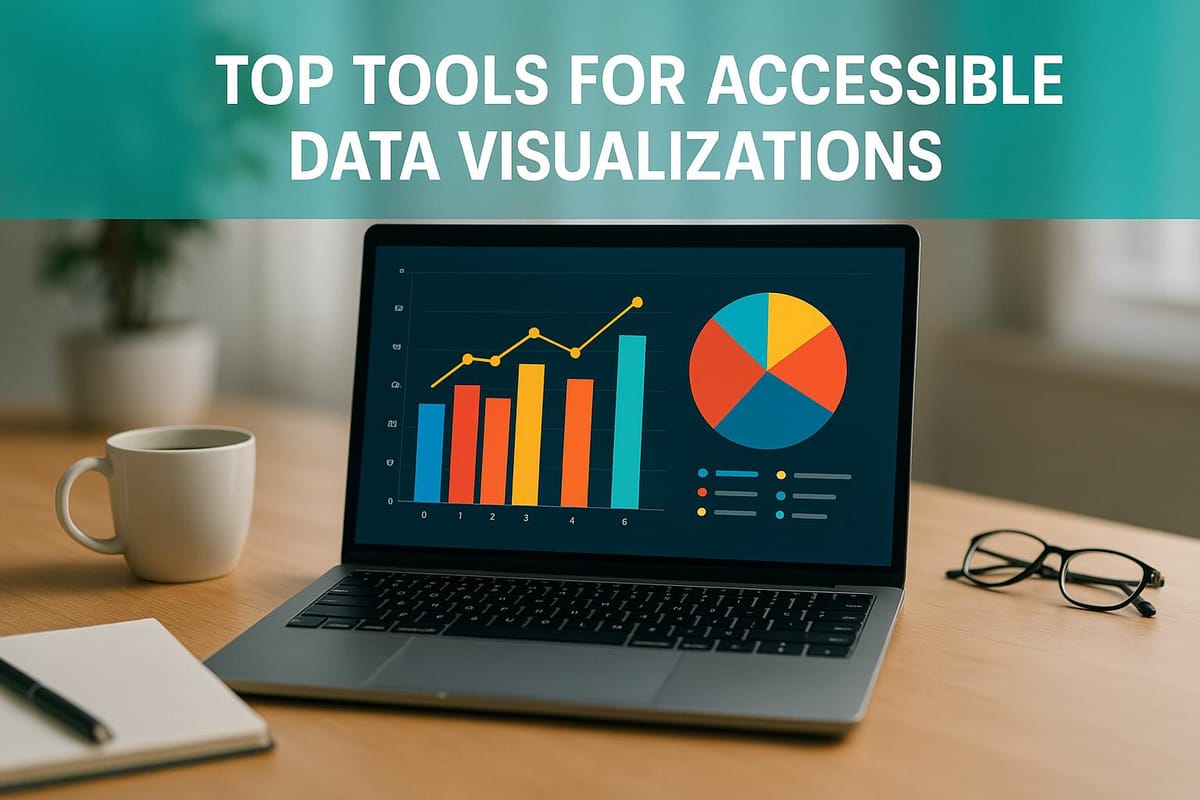
Top Tools for Accessible Data Visualizations
Explore top tools for creating accessible data visualizations that cater to all users, including those with disabilities, while meeting legal standards.
Accessible data visualization ensures that everyone, including individuals with disabilities, can understand and interact with visual content. This article reviews ten tools that help create accessible charts, graphs, and dashboards while meeting legal standards like WCAG 2.1 AA and Section 508. Here's a quick summary of the tools covered:
- Domo: Enterprise-level platform with accessibility features like screen reader support and keyboard navigation.
- Tableau: Offers features like screen reader compatibility, keyboard shortcuts, and color-blind friendly palettes.
- Microsoft Power BI: Integrates seamlessly with Microsoft tools and supports high contrast themes and screen readers.
- Qlik Sense: Focuses on self-service analytics with features like ARIA labels and alt text.
- Sisense: Best for large datasets with real-time updates, though accessibility details are limited.
- Zoho Analytics: A simpler tool for small businesses, but with limited accessibility information.
- Google Looker Studio: Free and user-friendly, though accessibility features are basic.
- Canva: Great for beginners creating simple visuals, but lacks advanced accessibility options.
- Quadratic: Spreadsheet-style tool with modern accessibility standards.
- D3.js: A coding library offering full customization, including ARIA labels and semantic HTML.
Quick Comparison
| Tool | Accessibility Features | Best For | Ease of Use |
|---|---|---|---|
| Domo | Screen reader, keyboard navigation, WCAG-compliant | Enterprise dashboards | Moderate |
| Tableau | Screen reader, keyboard shortcuts, color palettes | Complex data analysis | Steep |
| Microsoft Power BI | High contrast, screen reader, keyboard support | Microsoft integrations | Moderate |
| Qlik Sense | ARIA labels, alt text, keyboard navigation | Exploratory analysis | Moderate |
| Sisense | Limited details, supports screen readers | Large datasets | Moderate |
| Zoho Analytics | Basic features, keyboard navigation | Small businesses | Easy |
| Google Looker Studio | Basic accessibility, free | Marketing reports | Easy |
| Canva | Alt text, basic keyboard shortcuts | Simple visuals | Very Easy |
| Quadratic | Keyboard navigation, clean design | Collaborative analysis | Easy |
| D3.js | Fully customizable, ARIA labels | Custom visualizations | Very Steep |
Choose a tool based on your technical skills, budget, and specific needs. For high customization, D3.js is ideal but requires coding expertise. For ease of use, Canva and Looker Studio are great options. Enterprise users may prefer Domo, Tableau, or Sisense for handling complex data.
Accessible Data Visualizations 101 - axe-con 2021
1. Domo
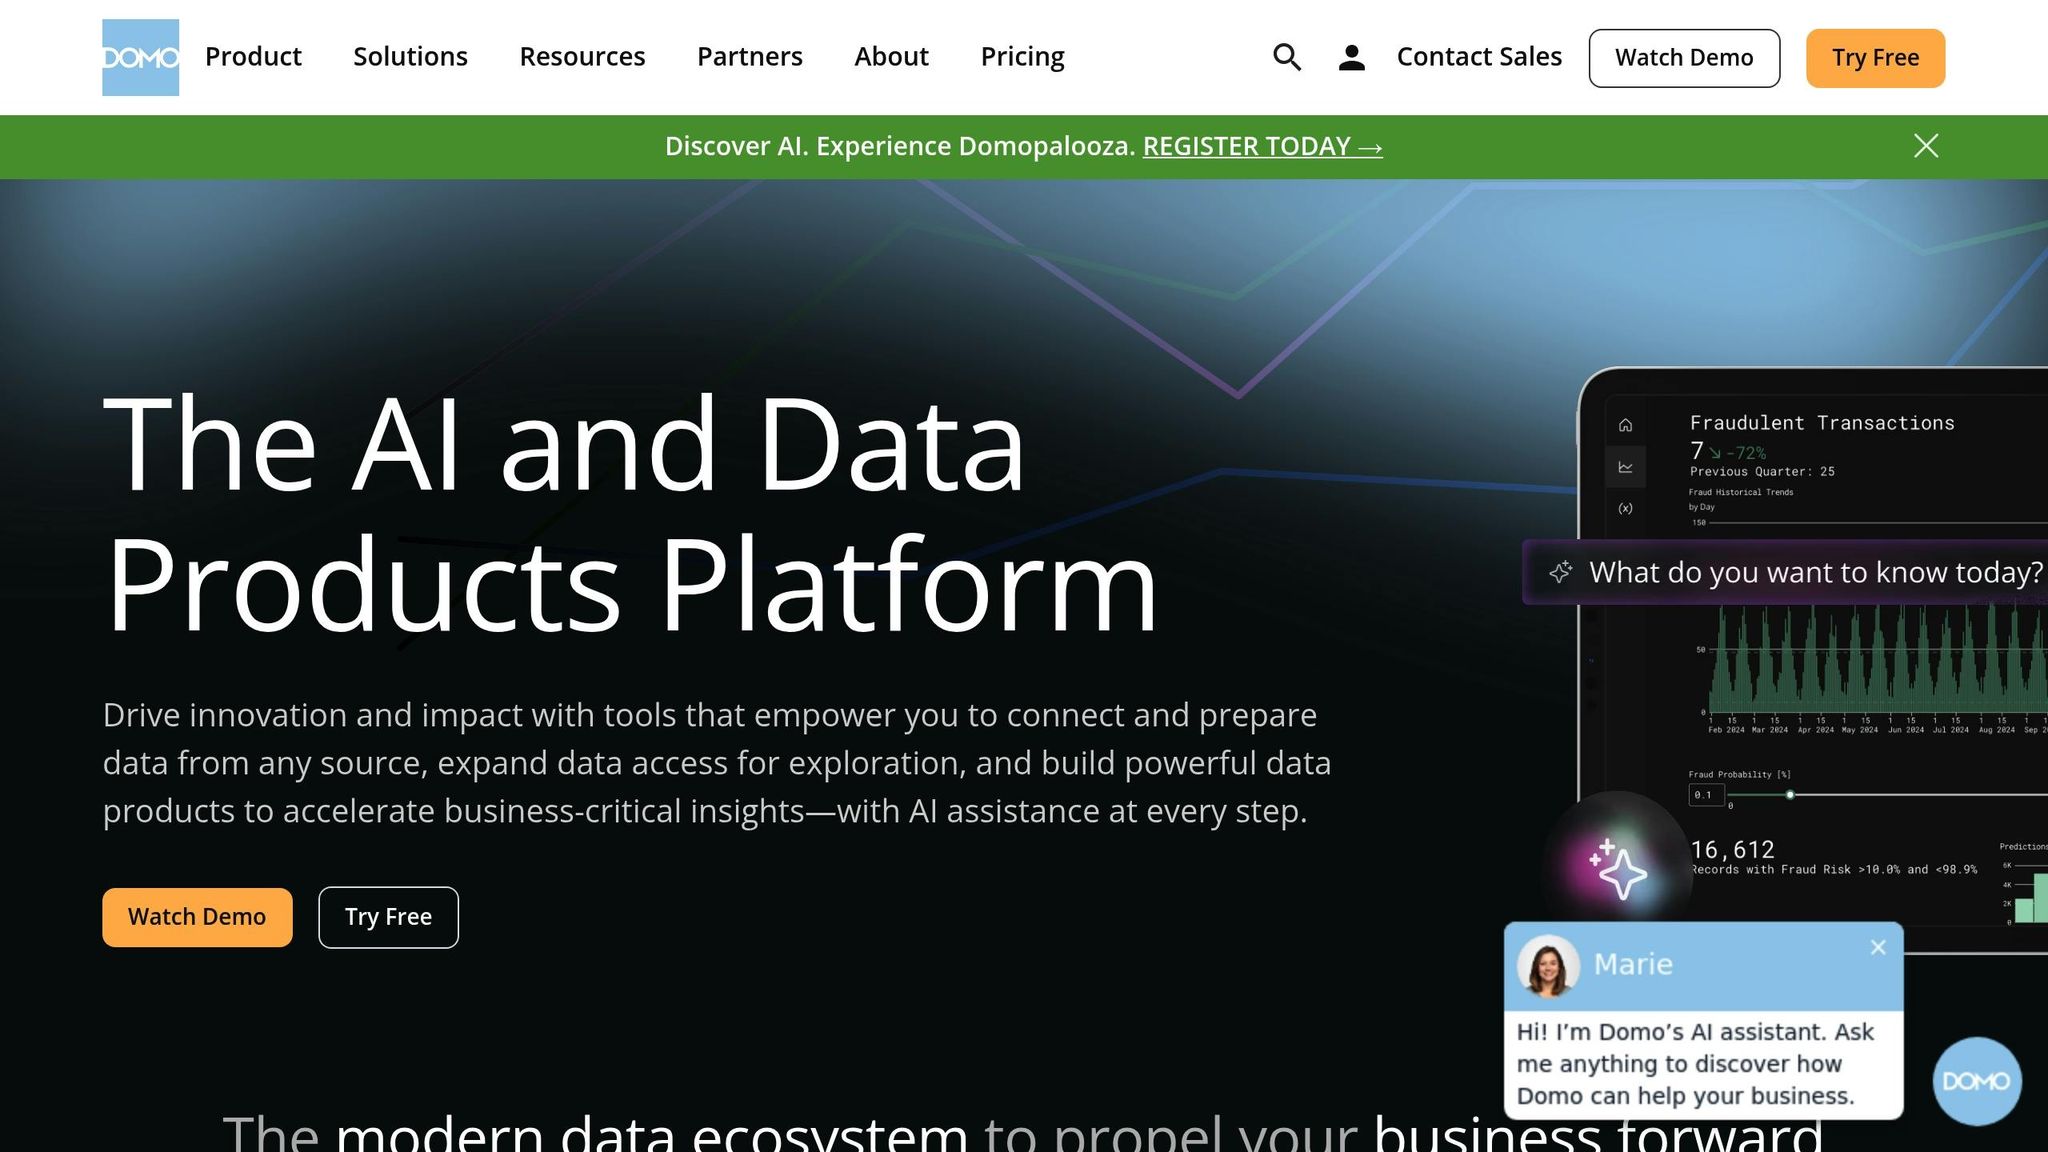
Domo is a cloud-based business intelligence platform widely used for enterprise-level data visualization. It stands out for its ability to handle complex datasets while offering intuitive visualizations. For detailed information about its accessibility features, refer to Domo's official documentation, which provides comprehensive guidance on how the platform ensures usability for diverse audiences.
2. Tableau
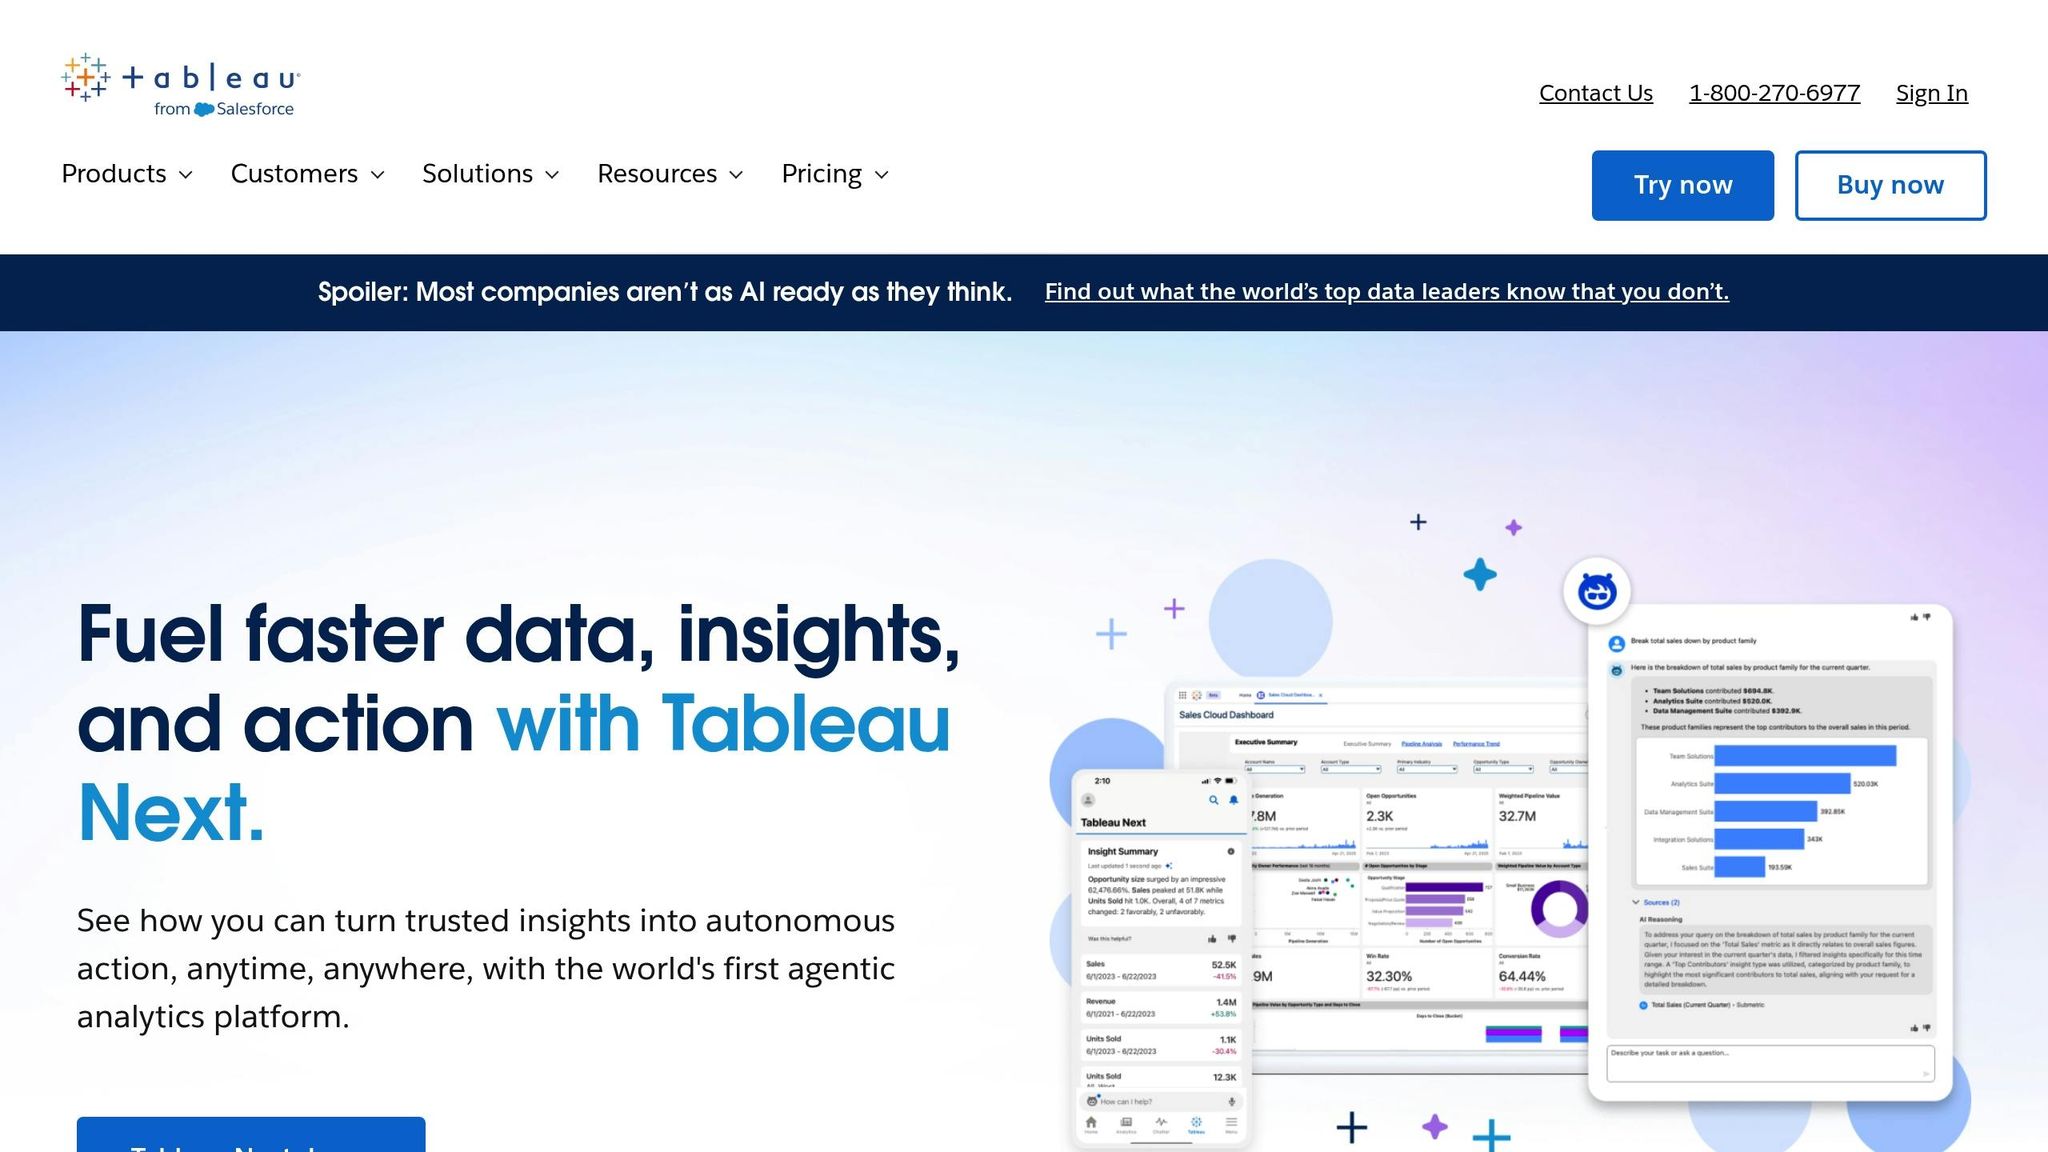
Tableau stands out for its ability to create powerful, user-friendly data visualizations. One of its key strengths lies in its commitment to inclusivity, offering features that make data visualization more accessible to everyone. Let’s take a closer look at how its accessibility options and integration capabilities enhance the user experience.
Accessibility Features
Tableau makes it easier for users to interact with complex data, thanks to its thoughtful accessibility features:
- Keyboard Navigation: Navigate through Tableau without a mouse, making it ideal for users who rely on keyboard shortcuts.
- Screen Reader Compatibility: Works smoothly with popular screen readers like JAWS and NVDA, providing clear audio descriptions for better understanding.
- Adjustable Color Contrast: Offers customizable color settings to accommodate users with color vision deficiencies.
These features ensure that Tableau remains a tool that everyone can use effectively, regardless of their abilities.
Integration with Other Tools
Tableau doesn’t just stop at accessibility - it also excels in integrating with widely-used business tools. Whether you're pulling data from Microsoft Excel, Salesforce, or Google Analytics, Tableau makes it simple to incorporate that information into your visualizations. This seamless integration helps users streamline their workflows and create more comprehensive data stories without jumping between multiple platforms.
3. Microsoft Power BI

Microsoft Power BI is a well-known business intelligence tool within the Microsoft ecosystem, designed to make data visualization more accessible and seamlessly integrate with other Microsoft applications. It stands out by combining intuitive features with familiar tools, ensuring a user-friendly experience for a wide range of users.
Accessibility and Integration Features
Power BI provides several features that enhance accessibility and streamline integration:
- Keyboard Navigation: Users can navigate dashboards and reports entirely with a keyboard, eliminating the need for a mouse.
- High Contrast and Color Options: Built-in themes support users with color vision deficiencies or other visual impairments.
- Screen Reader Compatibility: Fully compatible with screen readers like JAWS and NVDA, offering audio descriptions for better usability.
- Microsoft Office Integration: Connects effortlessly with Excel, SharePoint, and Teams, creating smooth workflows.
- Real-Time Data Connections: Links to over 100 data sources, including SQL Server, Azure, and various third-party applications, ensuring up-to-date insights.
Power BI vs. Personalized Career Support
While Power BI is exceptional for creating accessible visualizations, it serves a completely different purpose from tools designed for career development. For example, scale.jobs focuses on personalized job search assistance. Unlike automated platforms, scale.jobs offers human-driven services like ATS-friendly resume creation, tailored cover letters, and full application management. Clients benefit from transparent updates via WhatsApp, detailed proof-of-work screenshots, and a straightforward one-time payment model. This hands-on approach delivers the personal accountability and customized support that data tools like Power BI simply aren’t built to provide.
4. Qlik Sense

Qlik Sense is built around an associative data engine, allowing users to explore data freely across multiple dimensions, without being limited by traditional query structures. This makes it a highly effective platform for both self-service analytics and large-scale enterprise deployments, offering organizations a robust tool for diving deep into their data.
Accessibility Features
Qlik Sense includes a range of features designed to meet the needs of users with diverse abilities. For those with mobility challenges, the platform supports keyboard navigation, enabling seamless interaction without relying on a mouse.
It also integrates screen reader compatibility, making data visualizations and dashboards accessible to visually impaired users. Popular screen readers like JAWS and NVDA are supported, providing audio descriptions for charts and key data points.
For users with color vision deficiencies, Qlik Sense offers color contrast adjustments, ensuring clarity in visualizations. The platform also supports alt text for charts and images, allowing users to add descriptive labels that enhance understanding. These accessibility features align well with the platform’s broader focus on usability and inclusivity.
Ease of Integration with Other Tools/Platforms
Qlik Sense stands out for its ability to integrate with a wide variety of tools and platforms. It connects easily to data sources such as SQL databases, cloud storage services, and APIs. Additionally, it works seamlessly with enterprise solutions like Salesforce, SAP, and Microsoft products.
Common use cases include embedding Qlik Sense dashboards into web portals, automating data updates from external sources, and exporting reports in formats that are compatible with other analytics tools. With its real-time integration capabilities, users can rely on up-to-date dashboards that reflect the latest data.
Best Use Cases
Qlik Sense is particularly effective for organizations that need advanced analytics and a flexible approach to data exploration. Its associative data engine is perfect for uncovering hidden patterns and relationships within large, complex datasets, making it an excellent choice for enterprise environments and experienced data teams.
While its self-service analytics features make it accessible to a broader audience, the platform’s advanced capabilities can pose a learning curve for beginners. However, its AI-powered features, such as automated data cleaning and natural language processing, help bridge the gap for less technical users. Educational institutions and data science teams also benefit from these advanced tools, which streamline workflows and enhance productivity.
Given its depth, Qlik Sense is best suited for businesses that prioritize detailed analytics and are willing to invest time and resources into mastering the platform.
Pricing and Affordability
Qlik Sense’s cloud-based plans start at $30 per user per month, placing it in the mid-range of data visualization tools. For comparison, Power BI starts at $10 per month, while Tableau comes in at around $70 per month.
For larger organizations, custom pricing is available based on factors like the number of users, deployment type, and required features. While the initial setup and licensing costs may be higher for enterprise-level use, the platform’s scalability and advanced analytics tools often make it a worthwhile investment for companies with complex data needs.
5. Sisense
Sisense stands out as a business intelligence platform designed to handle complex data analysis and visualization, especially for large and varied datasets. Its approach simplifies the process of preparing and visualizing data, making it a strong option for organizations with intricate data needs.
Accessibility Features
While Sisense offers a robust platform, its documentation provides limited details about accessibility features. For specifics on aspects like screen reader compatibility, keyboard navigation, or adherence to WCAG standards, it's recommended to contact Sisense directly. Despite this lack of clarity, the platform's strength lies in its ability to unify data from diverse sources seamlessly.
Ease of Integration with Other Tools/Platforms
One of Sisense's key strengths is its ability to integrate data from multiple sources. It connects effortlessly with major enterprise systems and cloud storage solutions, making it highly versatile.
At the core of this capability is its ElastiCube technology, which consolidates disparate data into a single, optimized dataset. Developers can leverage REST APIs and SDKs to embed dashboards into existing applications or automate data workflows. Features like real-time data updates and scheduled refreshes ensure that visualizations always reflect the latest information. This integration capability makes Sisense a practical choice for organizations managing complex data environments.
Best Use Cases
Sisense is particularly well-suited for mid-to-large enterprises that need to analyze and visualize complex datasets from multiple sources. By consolidating diverse data into clear, actionable visual insights, it supports business analysts and data teams in creating visualizations without requiring extensive technical knowledge. IT departments also appreciate its centralized data management features.
However, smaller organizations or individual users may find its enterprise-focused features and pricing more than they need for basic visualization tasks.
Pricing and Affordability
Sisense operates on a custom pricing model, factoring in the number of users, data volume, and selected features. To get a quote, organizations need to contact Sisense directly. Positioned in a higher price range compared to some competitors, it's important to also consider potential additional costs, such as implementation, training, and ongoing support, when evaluating its overall affordability.
6. Zoho Analytics
Zoho Analytics is another option worth considering in the realm of visualization tools. Developed by Zoho, this business intelligence platform provides various features for data analysis and reporting. However, specific details about its accessibility features, integrations, use cases, and pricing are not readily available. For the most accurate and up-to-date information, it's best to visit Zoho's official website or refer to trusted industry reviews.
7. Google Looker Studio
Let’s take a closer look at Google Looker Studio, a tool designed to transform raw data into interactive dashboards - at no cost.
Google Looker Studio, previously known as Google Data Studio, is a user-friendly platform that helps users create engaging visual data stories. Its straightforward interface makes it a go-to choice for anyone aiming to present data in a clear and interactive way.
Accessibility Features
While Google Looker Studio doesn’t offer detailed public guidelines on accessibility, users can apply standard best practices to ensure their dashboards are usable for all audiences.
Ease of Integration with Other Tools/Platforms
Specific integration details aren’t extensively documented. Users will need to confirm compatibility with their preferred data sources to ensure seamless connections.
Pricing and Affordability
The best part? Google Looker Studio is entirely free to use, with no limits on the number of reports or dashboards you can create. Additional costs might only come into play if you opt for premium data sources or exceed certain usage thresholds. It’s a solid option for budget-conscious users seeking robust visualization capabilities.
8. Canva
Canva, widely known for its user-friendly graphic design platform, also offers tools for creating basic charts and infographics. Its drag-and-drop interface makes designing straightforward and accessible for beginners. However, detailed guidance on ensuring accessibility for data visualizations within Canva is limited. Unlike specialized data visualization tools, Canva prioritizes simplicity and ease of design over in-depth accessibility features.
9. Quadratic

There isn't much verified information available about Quadratic's accessibility, integration options, specific use cases, or pricing details. For the most accurate and current details, it's best to check directly on their official platform.
10. D3.js
D3.js is a JavaScript library that gives developers the tools to create fully customized, interactive visualizations through code. While it requires programming skills, it offers unparalleled flexibility to meet specific needs, including accessibility standards. This makes it a go-to choice for developers comfortable with coding.
Accessibility Features
With D3.js, developers can craft visualizations that are accessible to a wide range of users. You can implement semantic HTML structures, add ARIA labels, and enable keyboard navigation for better usability. The library also supports screen readers by allowing the creation of alternative text descriptions and data tables, ensuring that non-visual users can access the same information presented in the charts.
Managing color contrast is another area where D3.js excels. Because developers have complete control over the color palette, it’s easy to create designs that meet accessibility guidelines. These features make D3.js a versatile tool for developers prioritizing inclusivity.
Ease of Integration with Other Tools/Platforms
D3.js plays nicely with nearly any web-based platform or framework. Whether you're working with React, Angular, or Vue.js, you can embed D3.js visualizations seamlessly. It also complements data processing tools like Python's pandas or R, allowing you to prepare data in those environments and then visualize it using D3.js.
Since D3.js outputs standard web technologies like HTML, CSS, and SVG, its visualizations can be easily embedded in websites, mobile apps, or even exported as static images for presentations. This flexibility makes it a favorite among developers working within modern frameworks.
Best Use Cases
D3.js shines in projects that demand highly customized, interactive visualizations. It’s ideal for developers or teams who need precise control over every aspect of their charts. However, because it relies on coding, it might not be the best choice for beginners or those looking for pre-built, ready-to-use solutions.
Pricing and Affordability
D3.js is completely free and open-source. The only cost involved is your time and expertise in development.
Tool Comparison Chart
Choose a tool that aligns with your needs, skill level, and accessibility requirements. The chart below highlights key features to help you make an informed decision.
| Tool | Accessibility Features | Best Use Cases | Learning Curve |
|---|---|---|---|
| Domo | Screen reader support, keyboard navigation, WCAG compliance, alt text for charts | Enterprise dashboards, real-time business intelligence, large-scale data integration | Moderate to steep |
| Tableau | Built-in accessibility features, keyboard shortcuts, screen reader compatibility, color-blind friendly palettes | Complex data analysis, interactive dashboards, statistical visualizations | Steep |
| Microsoft Power BI | High contrast mode, keyboard navigation, screen reader support, accessibility checker | Microsoft ecosystem integration, business reporting, departmental analytics | Moderate |
| Qlik Sense | Keyboard navigation, screen reader support, high contrast themes, ARIA labels | Self-service analytics, associative data modeling, exploratory analysis | Moderate |
| Sisense | Screen reader compatibility, keyboard shortcuts, customizable color schemes | Complex data fusion, AI-driven insights, embedded analytics | Moderate to steep |
| Zoho Analytics | Basic accessibility features, keyboard navigation, export options for screen readers | Small to medium businesses, integrated reporting, collaborative analytics | Easy to moderate |
| Google Looker Studio | Screen reader support, keyboard navigation, Google Workspace integration | Marketing reports, Google Analytics integration, collaborative dashboards | Easy |
| Canva | Alt text support, keyboard shortcuts, high contrast options, simple interface | Simple infographics, presentation visuals, social media graphics | Very easy |
| Quadratic | Modern web accessibility standards, keyboard navigation, clean interface design | Spreadsheet-style data analysis, Python integration, collaborative work | Easy to moderate |
| D3.js | Fully customizable accessibility features - including ARIA labels and semantic HTML | Custom interactive visualizations, web applications, unique chart types | Very steep |
Enterprise vs. Small Business Considerations
For large organizations, tools like Domo, Tableau, and Sisense are ideal for managing massive datasets with strong governance. On the other hand, small businesses often find Power BI, Zoho Analytics, or Google Looker Studio more practical for integrated reporting and ease of use.
Accessibility Compliance Levels
If meeting strict WCAG 2.1 AA compliance is a priority, Tableau and Power BI stand out as top choices. D3.js can also meet these standards but requires significant development effort. For simpler needs, Canva and Looker Studio offer basic accessibility support.
Technical Expertise Requirements
For non-technical users, tools like Canva, Looker Studio, and Zoho Analytics provide intuitive interfaces. Power BI and Qlik Sense strike a balance between simplicity and advanced features. Meanwhile, tools like Tableau, Domo, and Sisense require more training but deliver powerful analytics capabilities. D3.js, with its steep learning curve, is best suited for experienced developers.
Integration Capabilities
Integration options vary widely across tools. Power BI connects seamlessly with Office 365, while Looker Studio integrates with Google Analytics and Google Sheets. Tableau and Qlik Sense support a wide range of data connectors, and Domo excels in real-time enterprise integrations. This chart serves as a quick reference to complement earlier discussions and help you compare key features effectively.
Final Thoughts
When choosing an accessible data visualization tool, it's crucial to consider your technical expertise, budget, and accessibility goals. These three factors will guide you toward a tool that aligns with your needs and ensures inclusivity.
Technical skills play a key role in your decision. If coding is in your wheelhouse, tools like D3.js provide unmatched customization. On the other hand, if coding isn't your strength, Power BI and Tableau offer a great mix of accessibility and ease of use.
Budget is another important factor to weigh. Smaller teams or organizations might find Google Looker Studio and Canva to be cost-effective choices. For larger teams with the resources to invest, Domo and Sisense bring advanced features that can handle more complex requirements.
Before making a switch, take the time to review your current visualizations. Pay attention to issues like screen reader compatibility and color contrast problems that might already exist.
Integration is also essential to ensure a smooth workflow. For those already using Microsoft 365, Power BI integrates seamlessly. Google Workspace users will appreciate the connectivity of Looker Studio. If your data comes from a variety of sources, Tableau's extensive library of connectors is often worth the learning curve.
Once you've selected a tool, plan for implementation. Enterprise-level tools like Tableau or Sisense may require 2-3 months for training and adoption. Simpler tools like Canva or Looker Studio can often be up and running in just a few weeks.
Take advantage of free trials - most tools offer 14-30 day trials - so you can test features like screen reader compatibility and keyboard navigation with your own data.
Finally, keep an eye on WCAG 2.1 AA standards as they evolve. Choose tools that prioritize accessibility with active roadmaps and regular updates, rather than those that treat it as an afterthought. Staying proactive ensures your visualizations remain inclusive and effective over time.
FAQs
What factors should I consider when choosing a data visualization tool that meets my organization's accessibility requirements?
When choosing a data visualization tool that meets your organization's accessibility requirements, it's essential to weigh a few key factors. Start by checking the tool's compatibility with assistive technologies, such as screen readers. Look for features that allow customization of color contrast and text size, and ensure the tool adheres to WCAG (Web Content Accessibility Guidelines) standards. These elements are crucial for creating inclusive visualizations.
Pay attention to practical features like clear labels, keyboard navigation, and alt text for visual elements. These can make a significant difference in usability for individuals with disabilities.
Also, consider your organization's specific needs. Do you primarily require straightforward charts, or are more intricate, interactive dashboards a priority? The tool you select should match these demands. To make the most informed decision, testing the tool's accessibility features with real users can offer invaluable feedback and help you better understand its strengths and limitations.
How do Tableau and Microsoft Power BI compare in terms of accessibility features?
Tableau and Microsoft Power BI both prioritize accessibility, but they approach it in slightly different ways. Tableau includes features like keyboard navigation, compatibility with screen readers, and high-contrast themes to make its platform more inclusive. Meanwhile, Microsoft Power BI leverages its connection to Microsoft's broader accessibility ecosystem, offering support for tools like Narrator, along with keyboard shortcuts and high-contrast visuals.
Choosing between the two often comes down to your organization's specific requirements and existing tools. If your workflows are already tied to Microsoft's ecosystem, Power BI might integrate more seamlessly. On the other hand, Tableau could be a better fit for those who need more flexibility in creating accessible visualizations.
Can beginners or non-technical users create accessible data visualizations using tools like Canva or Google Looker Studio?
Yes, even beginners or those without technical skills can create clear and accessible data visualizations using tools like Canva or Google Looker Studio. These platforms are designed to be intuitive, offering features that make the process straightforward and approachable.
Canva provides a drag-and-drop interface, customizable templates, and built-in accessibility options, such as tools to adjust color contrast for better visibility. On the other hand, Google Looker Studio (formerly Google Data Studio) enables users to link data sources and design interactive, shareable dashboards with ease. Both platforms are great choices for quickly crafting visually engaging and accessible visualizations without requiring advanced expertise.